Print Cost
Summary
Print-Cost is a project I built based on a personal experience from my college years, when I used to run a small printing business. At that time, pricing documents was still done manually—relying heavily on intuition, experience, and quick mental calculations in the middle of long customer queues.
Although the business is no longer running since I now work full-time, the problem itself is still very real. This project became my way of revisiting an old business pain point and solving it properly using Machine Learning and Data Science.
Background Problem
When I was operating the printing shop, I often had to:
- Serve customers who wanted to print documents
- Calculate printing prices page by page
- Handle office supply (ATK) sales at the same time
The challenge was that printing prices are not simply black-and-white. Some pages are full color, others are mostly black, and some only contain small colored elements like logos. During peak hours, calculating prices accurately while keeping the queue moving was both stressful and error-prone.
From the customer’s perspective, the experience was not ideal either:
- They had no clear price estimate before coming to the shop
- The final cost could feel unpredictable
- This sometimes led to dissatisfaction, even without any bad intent from the operator
On average, it took about 1 second per page just to decide the price category. That sounds small, but it becomes a serious bottleneck for documents with hundreds of pages.
The Idea
Based on that experience, a simple question came to mind:
“Why does printing cost still need to be calculated manually, when a document is essentially data?”
That question became the foundation of this project.
The goal was to build a system that could automatically:
- Analyze each page of a document
- Measure ink usage
- Assign a fair and consistent price category
Not just faster—but also more consistent and transparent for both operators and customers.
Approach
1. Feature Extraction
Each PDF page is converted into an image, then transformed from RGB into the CMYK color space. This makes it possible to calculate the percentage of Cyan, Magenta, Yellow, and Black ink usage per page.
2. Labeling with K-Means Clustering
Since the initial dataset had no price labels, I applied K-Means clustering to group 884 pages into 33 clusters based on color similarity.
These clusters were then manually mapped into 5 pricing categories (Rp500–Rp2000), making the labeling process 24× faster than labeling each page individually.
3. Classification with XGBoost
With labeled data available, I trained an XGBoost classifier. After experimenting with multiple quality settings, 7 DPI was chosen as the most efficient option—fast feature extraction with minimal impact on model performance.
Impact
Even though this project originated from a small business that no longer operates, the results were significant:
- 🚀 109× faster than manual pricing (109 pages per second)
- ⏱️ An 884-page document can be priced in 8.13 seconds
- 🎯 99% F1 Score, with business-oriented error handling:
- More tolerant of slight underpricing
- Actively avoiding overcharging customers
Beyond model performance, this project also improves the customer experience:
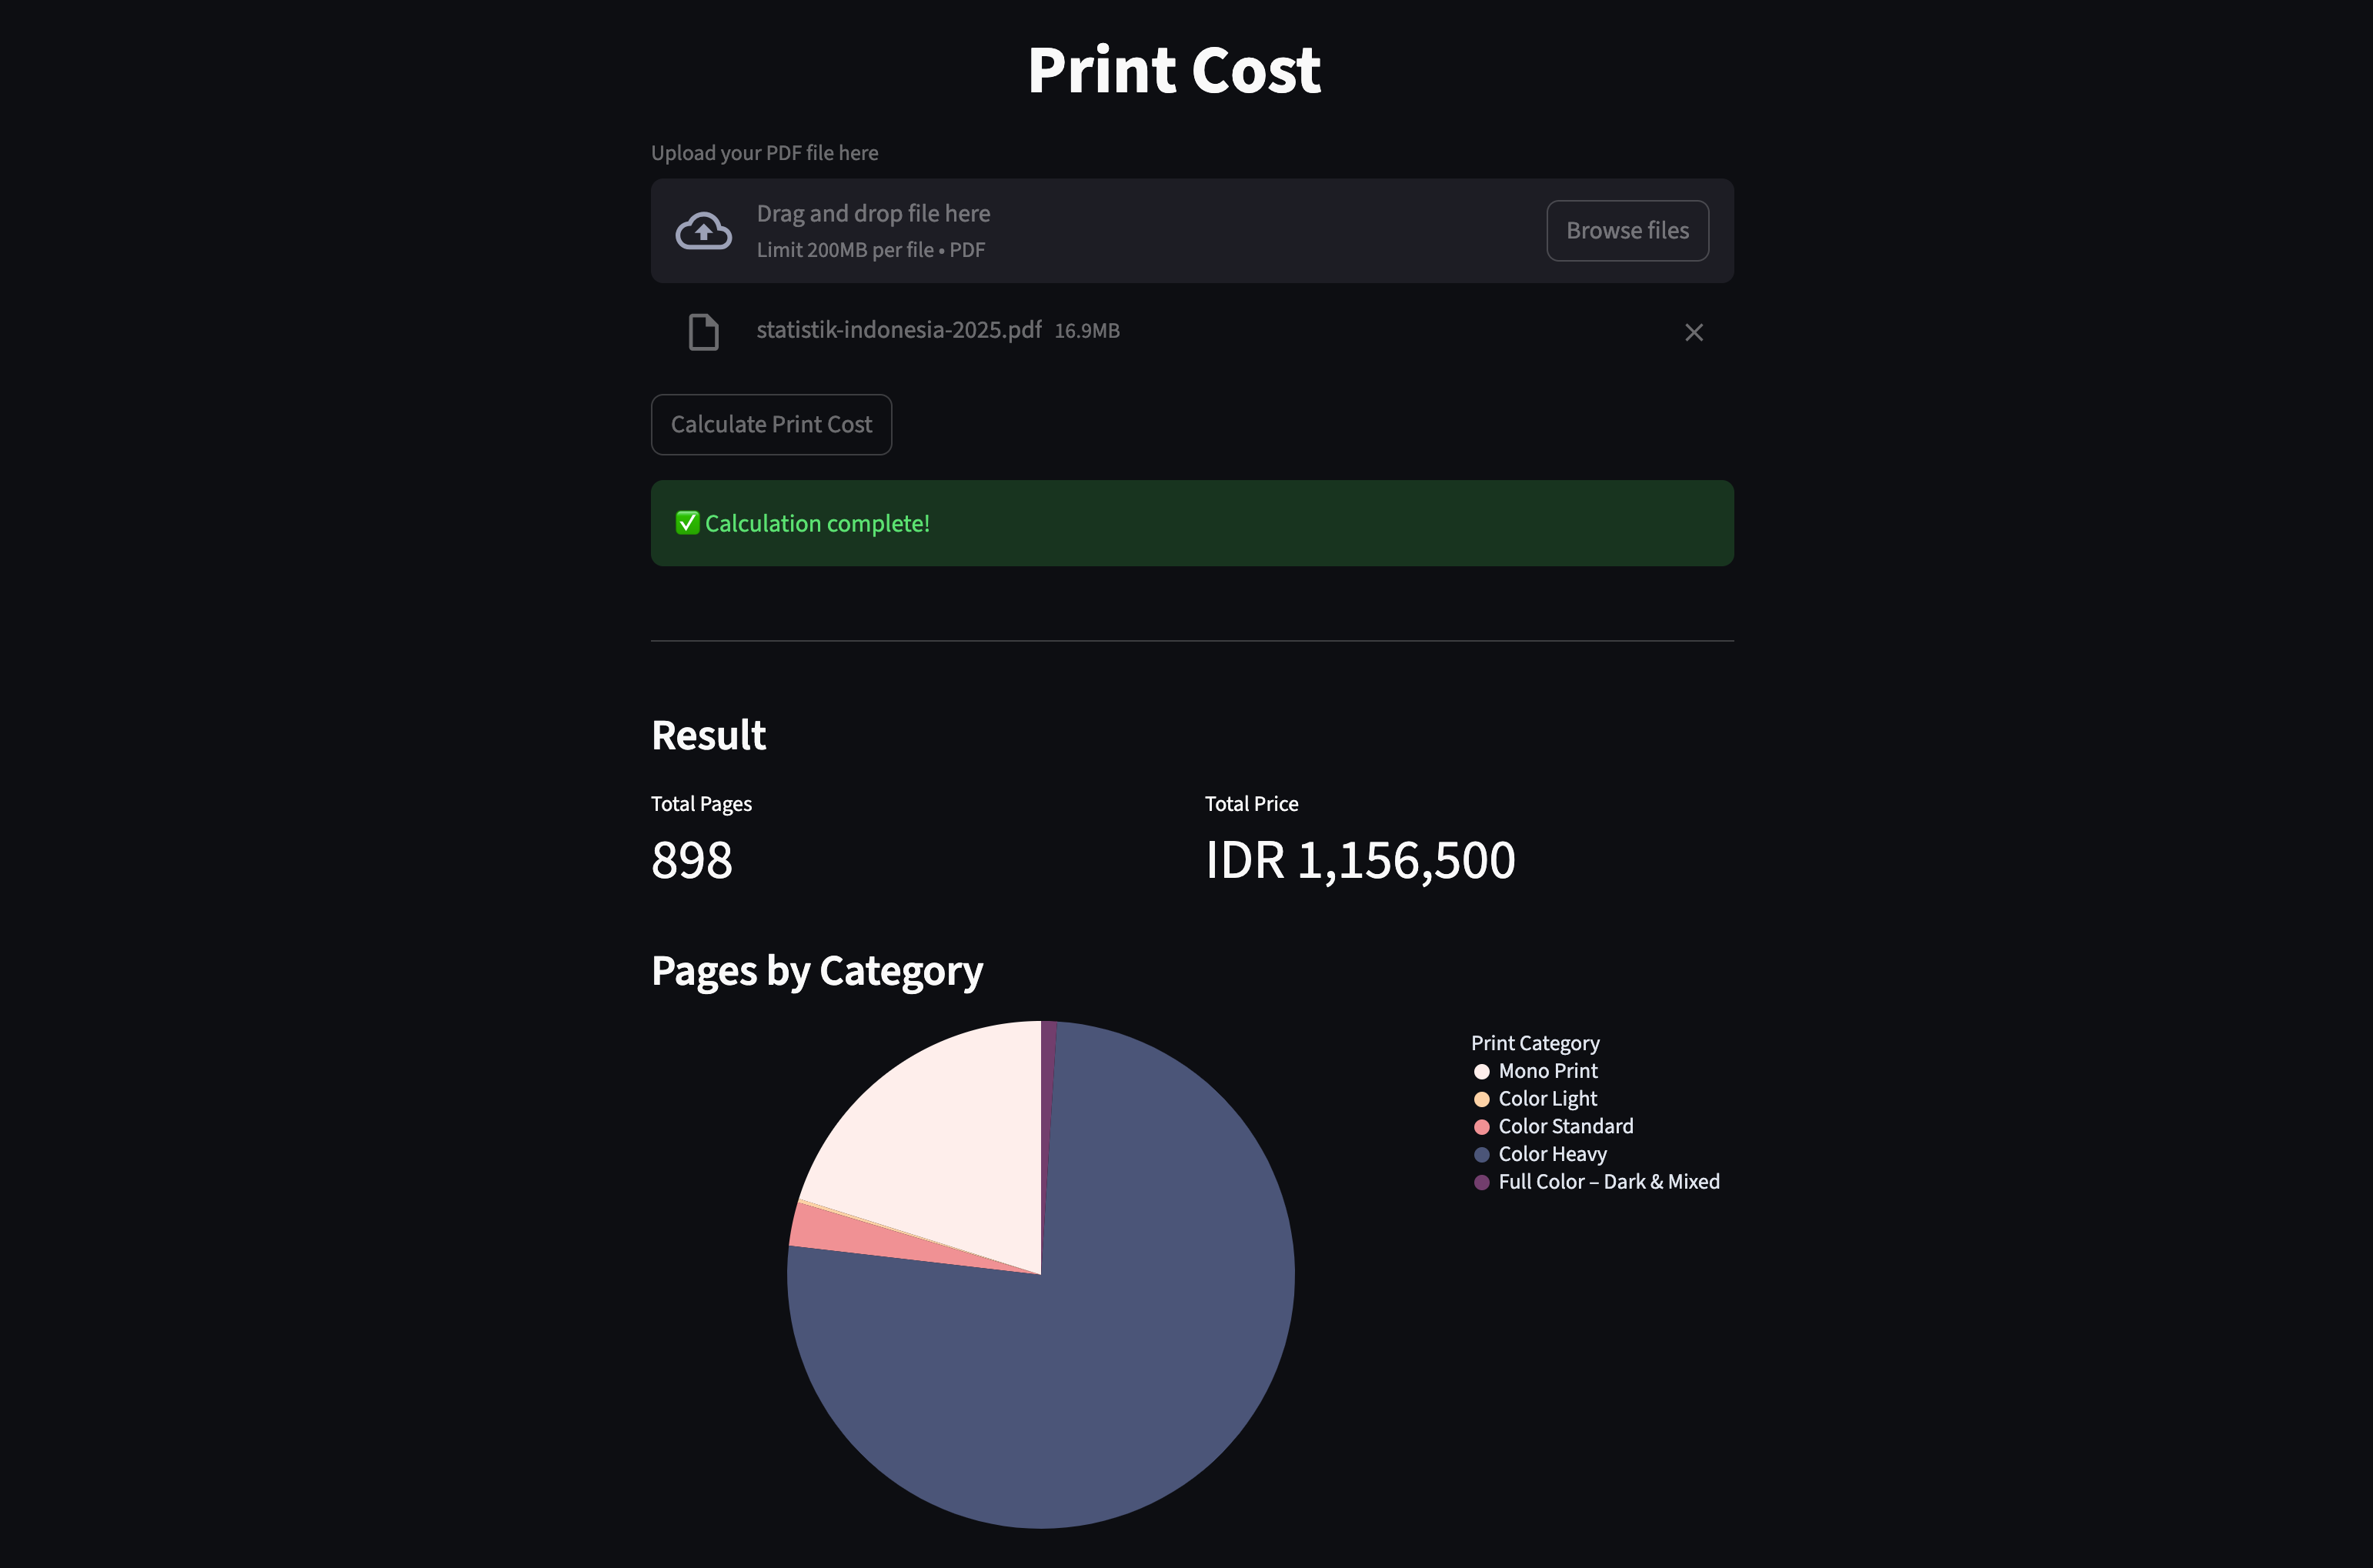
- 📄 A simple visual summary showing the total number of pages and final price
- 🥧 A pie chart displaying price category distribution based on color intensity per page
- 🖱️ Interactive visualizations with tooltips, allowing customers to see:
- How many pages fall into each price category
- Why certain documents cost more than others
These visuals make pricing more transparent and easier to understand, helping build trust between the printing service and its customers.
This shows how even simple operational problems can be transformed into scalable, data-driven solutions that benefit both the business and the end user.
Try It Yourself
If you’re curious how this works in practice, you can explore both the implementation and the live application:
-
🔗 GitHub Repository:
https://github.com/rasyidev/print-cost -
🚀 Live Demo:
https://rasyidev-print-cost.hf.space
The repository contains the full source code and model pipeline, while the live demo lets you experience how printing costs are calculated and visualized in real time.
Closing Thoughts
Print-Cost is more than just a Machine Learning project for me.
It represents a real-world problem I personally faced, revisited with better tools and experience.
Although the original printing business is no longer active, the problem still exists in many small print shops today. Through this project, I want to demonstrate how Data Science can genuinely improve small business operations—not just in theory, but in practice.